Main Dashboard
Your central hub for monitoring platform performance and managing campaigns.
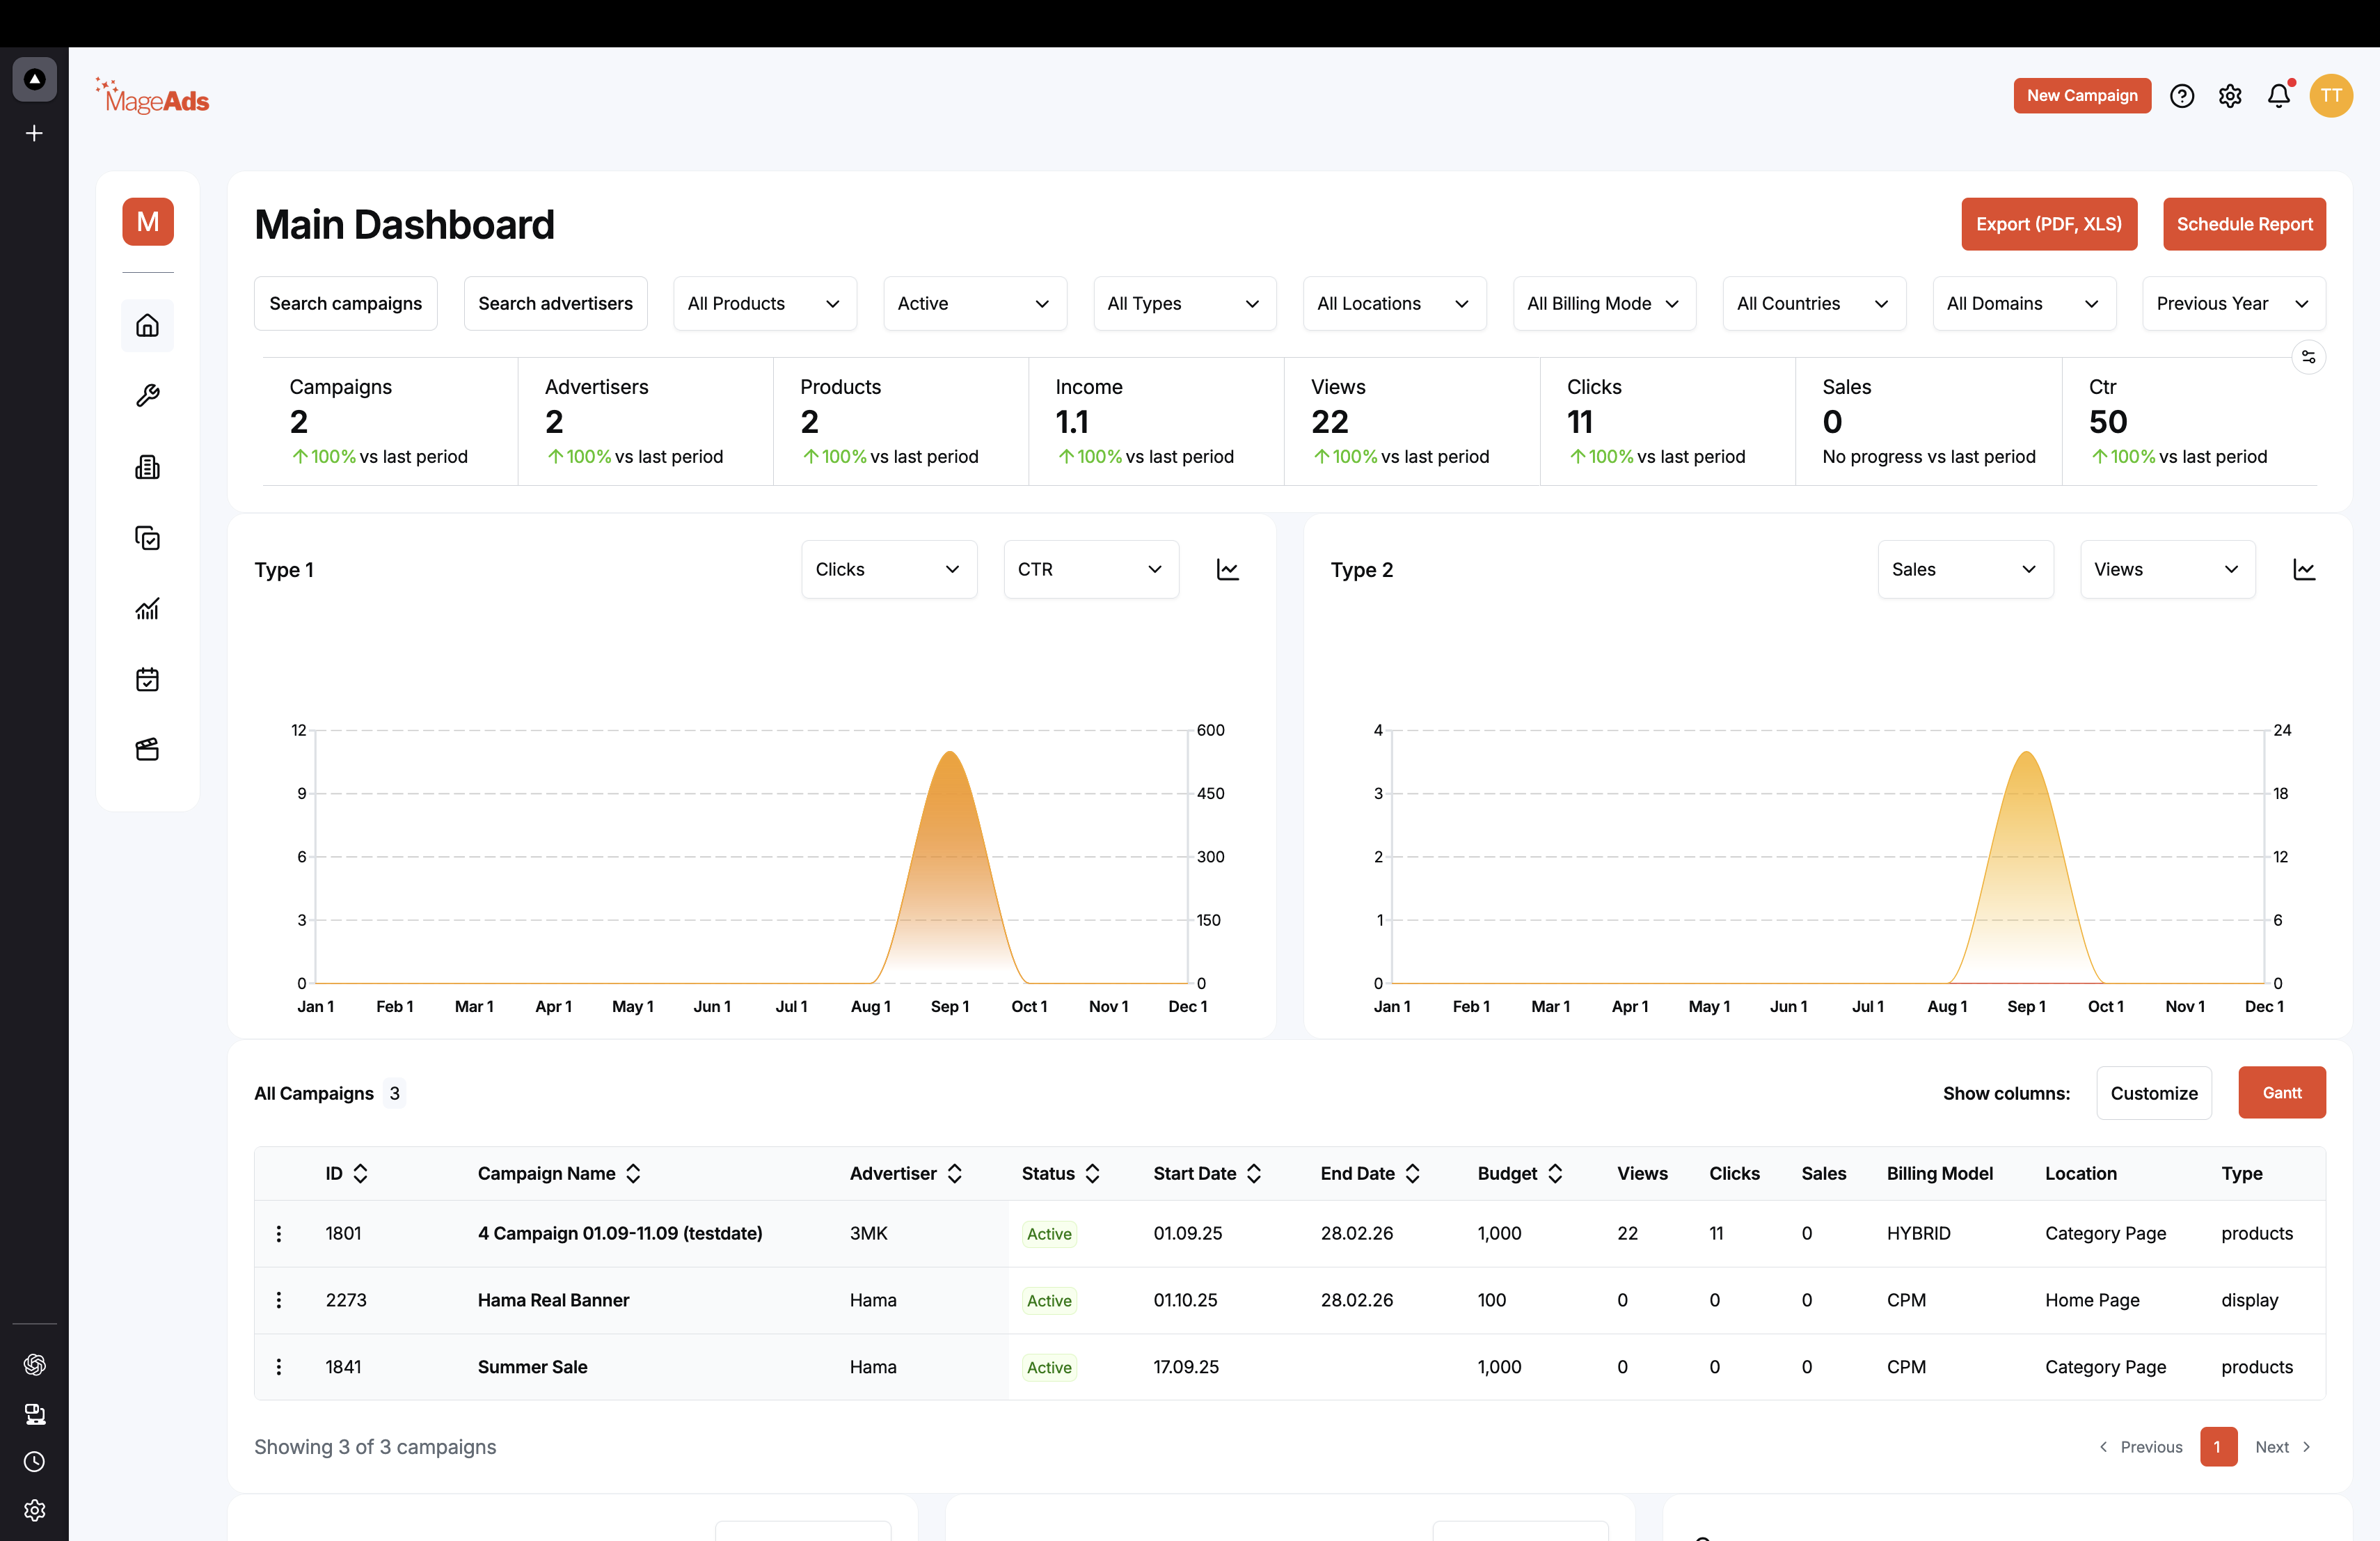
Dashboard Overview
The main dashboard provides real-time insights into your retail media platform:
Key Metrics
At the top of the dashboard, you'll see:
- Campaigns - Total number of active campaigns (with % change vs. last period)
- Advertisers - Number of active advertisers
- Products - Products being advertised
- Income - Total revenue generated
- Views - Ad impressions
- Clicks - Total ad clicks
- Sales - Number of sales
- CTR - Click-through rate
Performance Charts
Two main charts show trends over time:
Type 1 Chart:
- Clicks and CTR (Click-Through Rate)
- Time-based performance visualization
Type 2 Chart:
- Sales and Views correlation
- Track conversion trends
Campaigns Table
Below the charts, view all campaigns with:
- ID - Campaign identifier
- Campaign Name - Descriptive name
- Advertiser - Who is running the campaign
- Status - Active/Inactive/Paused
- Start/End Date - Campaign duration
- Budget - Allocated budget
- Views, Clicks, Sales - Performance metrics
- Billing Model - CPM, CPC, or HYBRID
- Location - Where ads appear
- Type - products or display
Dashboard Actions
Top Right Actions
- New Campaign - Create a new advertising campaign
- Export (PDF, XLS) - Download performance reports
- Schedule Report - Set up automated reporting
Filtering Options
Use the filter dropdowns to refine your view:
- Products filter
- Campaign status (Active/Inactive)
- Ad type
- Location
- Billing mode
- Country/Domain
- Time period
Quick Actions
From the dashboard, you can quickly:
- Create Campaign - Click "New Campaign" button
- Export Data - Generate PDF or Excel reports
- Schedule Reports - Automate report delivery
- View Campaign Details - Click any campaign row
Understanding the Metrics
Campaigns
Total active campaigns. Green arrow indicates growth compared to last period.
Income
Total ad revenue. Displayed in your account currency.
Views
Number of times ads were displayed to users.
Clicks
Total clicks on advertisements.
CTR (Click-Through Rate)
Percentage of views that resulted in clicks. Formula: (Clicks / Views) × 100
Sales
Number of conversions attributed to ads.
Next Steps
Tip: Use the dashboard filters to focus on specific campaigns, time periods, or advertisers for detailed analysis.